Documentation



blue-sampler
Generate large stealthy point patterns on the unit torus [0, 1)^D. Stealthy point patterns have vanishing density fluctuations at low (“blue”) frequencies, making them useful for Monte Carlo integration, image stippling, and any application that needs well-spread, low-discrepancy points. The main blue noise sampler (RGBN) implemented here have linear complexity in the number of points and the dimension, and run in under 15 minutes for 1 million 2D points.
📦 Installation
pip install blue_sampler
🚀 Quick start
import blue_sampler as blue

# 10 000 points in 2D
x = blue.sample_points(N=10_000, D=2)
blue.plot(x, auto_zoom=True)

# structure factor visualization
blue.plot_structure_factor(x)

# higher dimensions
x = blue.sample_points(N=2_000, D=5)

# image stippling
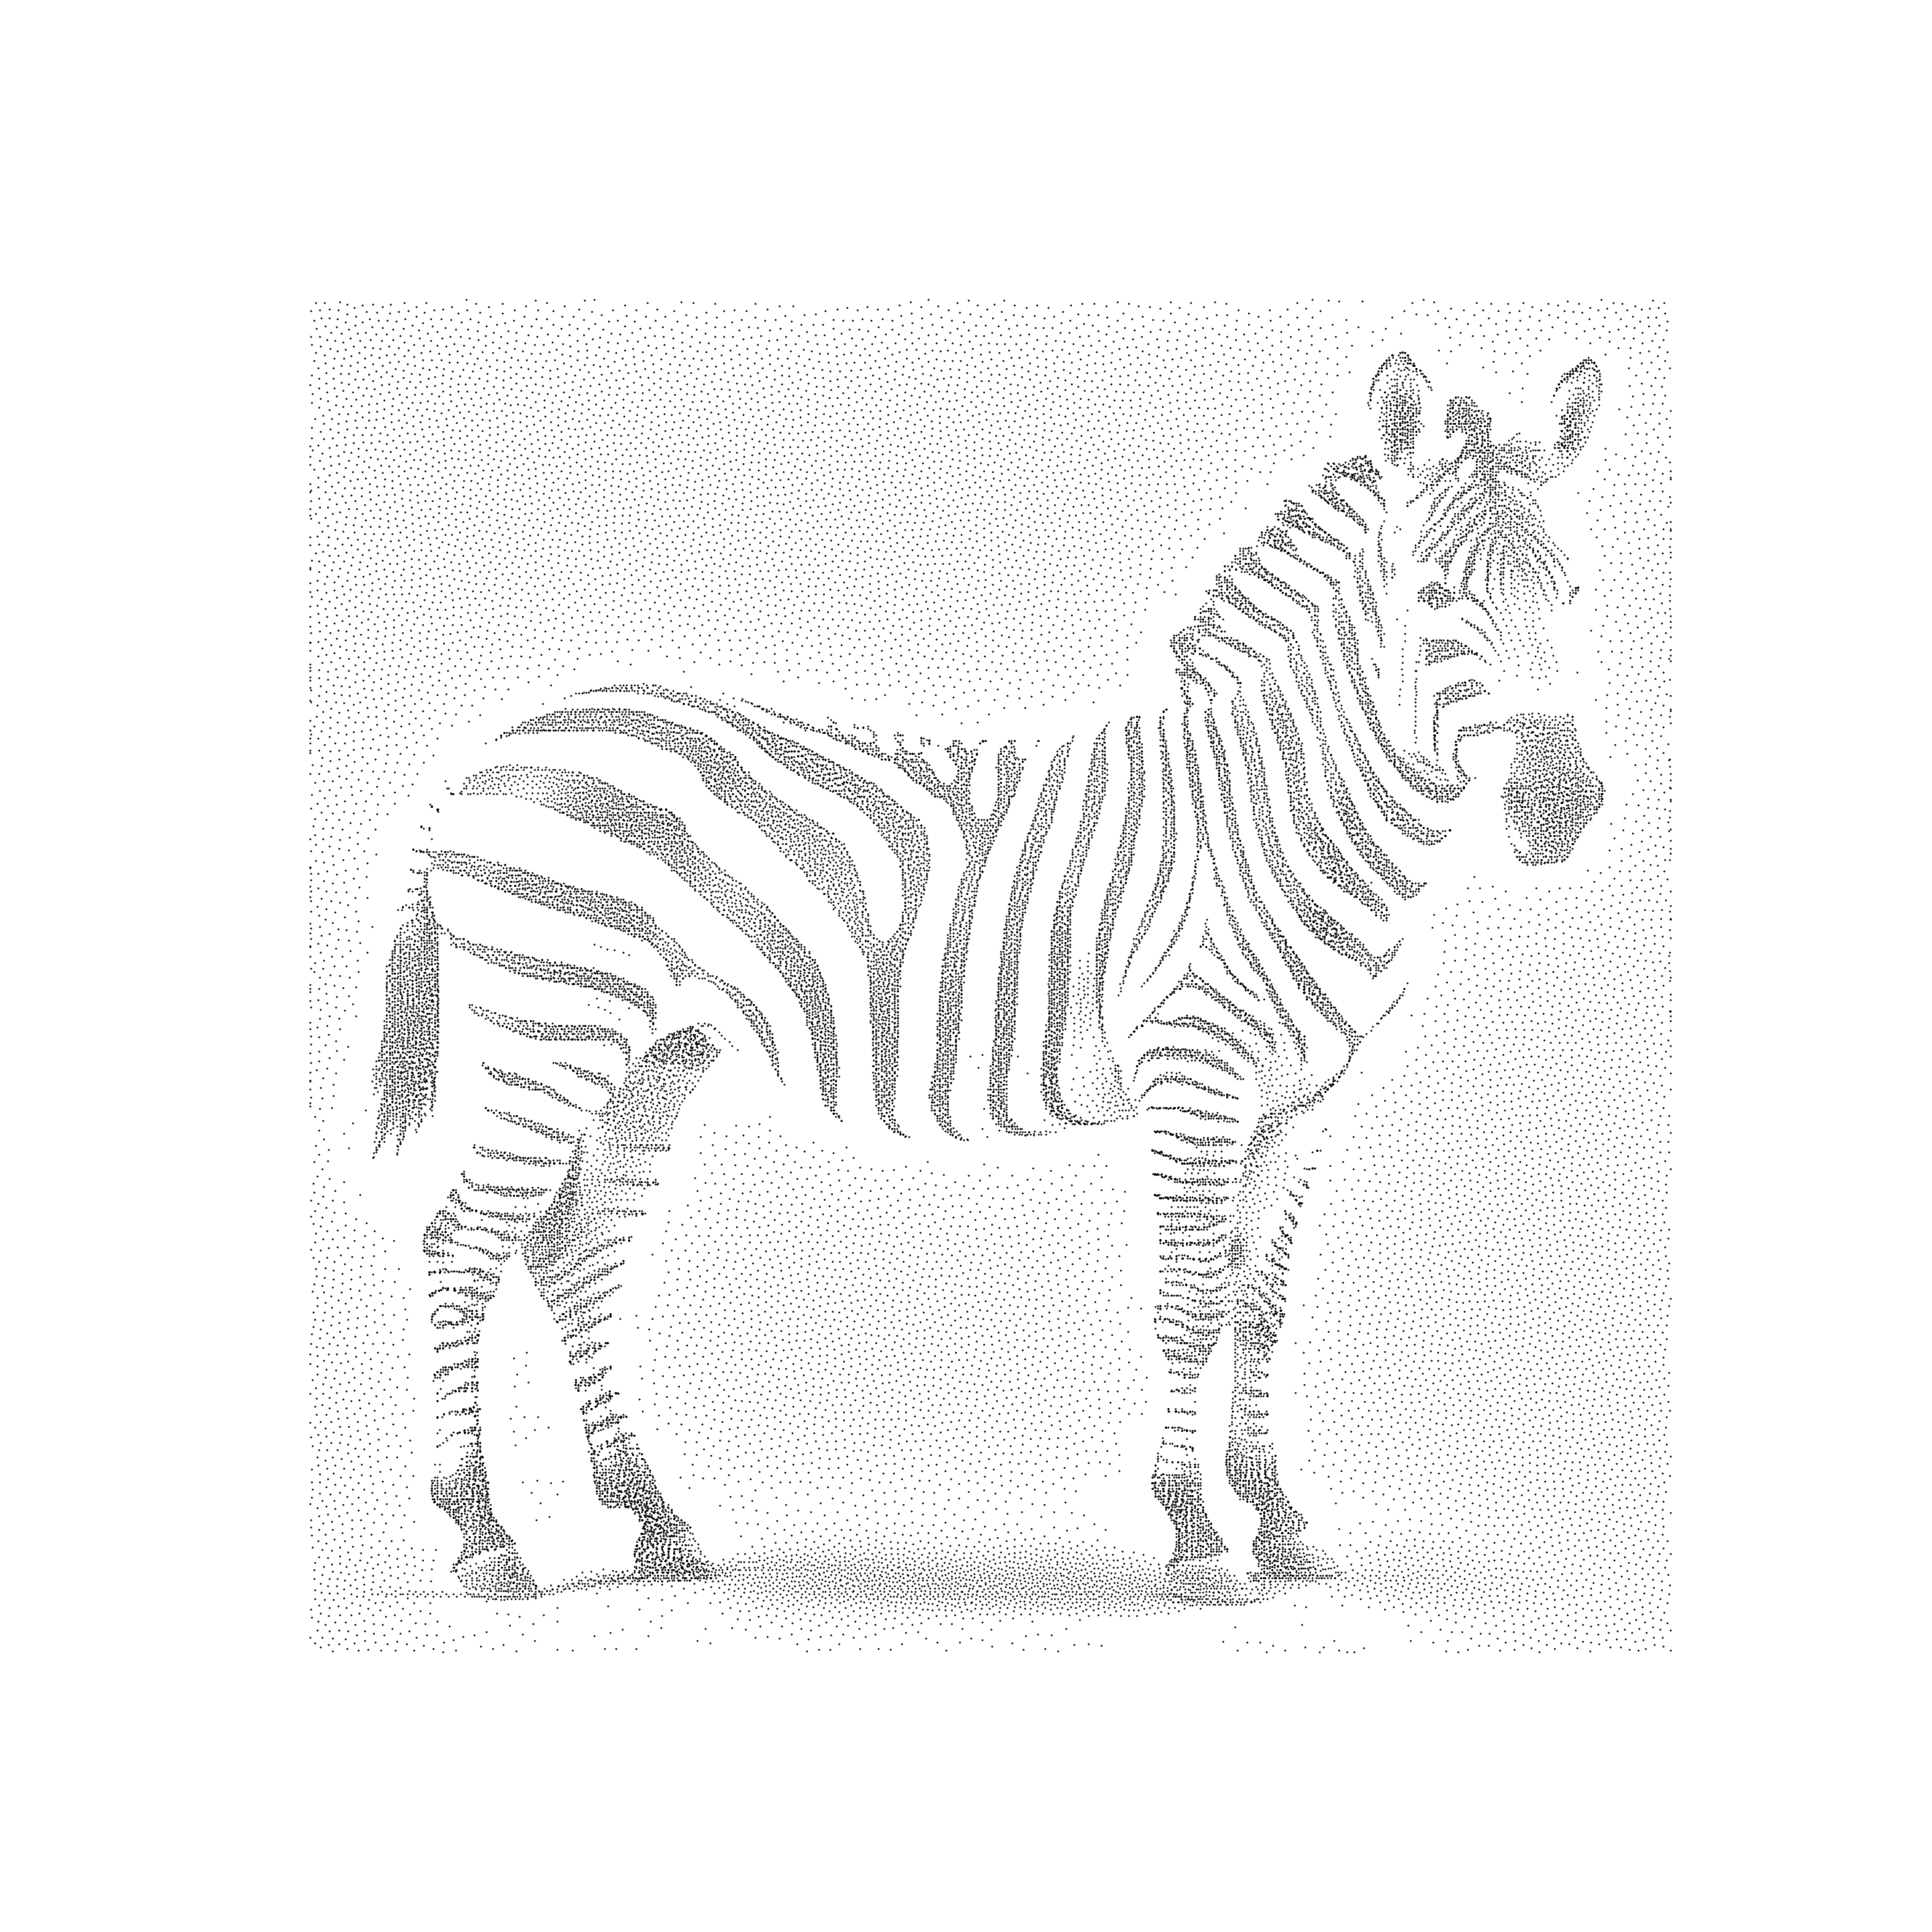
x = blue.im2points(image="zebra.jpg")
🖼️ Example
📊 Supported dimensions
Dimension |
Notes |
|---|---|
2D |
Fast, recommended |
3D |
~2× slower |
4–5D |
Works, more iterations needed |
≥6D |
Experimental (small N recommended) |
📚 Links
🌐 Project website: https://for-a-few-dpps-more.github.io/rgbn/
📖 Documentation: https://blue-sampler.readthedocs.io
📄 License
MIT
Main API
Stippling
|
simple wrapper for image stippling |
Sampling
|
Generate N stealthy (blue-noise) points in [0, 1)^D. |
|
Recursively split the unit square into N random quadrilaterals. |
|
Recursively partition a point set into N balanced clusters. |
|
Tile points on the unit torus to cover [0, 1)^D periodically. |
|
Convert tessels or clusters into low-discrepancy point set. |
Analysis
|
Estimate the radial structure factor S(k) via scattering intensity. |
Visualization
|
Scatter plot of a 2-D or 3-D point set. |
|
Log-log plot of the radial structure factor S(k). |
|
Display a tessellation across up to 12 recursion steps. |
|
Display a cluster partition across up to 12 recursion steps. |
Datasets
|